Captiva Sea Temperature
Looking to find out what the sea water temperature in Captiva is for today and the next few days? Below are data and charts that will give you information about sea temperatures in Captiva and nearby locations.
Water temperature in Captiva right now
Below is the current sea temperature for Captiva, United States on January 15, 2026.
Today
19.74° C
67.53° F
Yesterday
19.88° C
67.78° F
A week ago
20.34° C
68.6° F
At this temperature, water will feel cold compared to a swimming pool, but with a bit of experience and practice most people will find the water relatively comfortable to swim in.
The average sea temperature for Captiva on January 15 over the last 10 years is 19.74° C (67.53° F), with a low temperature of 18.22° C (64.8° F) and a high of 21.72° C (71.1° F).
Analysis and forecast for Captiva water temperatures
The water temperature in Captiva today is the same as the average temperature of 19.74° C (67.53° F) and the temperature on this day last year was 19.74° C (67.53° F).
The chart and table below shows the change in water temperature in Captiva over the last 30 days:
| Date | Temperature (Celsius) | Temperature (Fahrenheit) |
|---|---|---|
| January 15 | 19.74° C | 67.53° F |
| January 14 | 19.88° C | 67.78° F |
| January 13 | 19.91° C | 67.83° F |
| January 12 | 19.89° C | 67.8° F |
| January 11 | 19.85° C | 67.74° F |
| January 10 | 19.95° C | 67.91° F |
| January 9 | 20.13° C | 68.23° F |
| January 8 | 20.34° C | 68.6° F |
| January 7 | 20.55° C | 68.99° F |
| January 6 | 20.52° C | 68.94° F |
| January 5 | 20.76° C | 69.37° F |
| January 4 | 20.89° C | 69.6° F |
| January 3 | 20.91° C | 69.63° F |
| January 2 | 20.94° C | 69.7° F |
| January 1 | 20.93° C | 69.68° F |
| December 31 | 20.96° C | 69.74° F |
| December 30 | 20.98° C | 69.76° F |
| December 29 | 20.97° C | 69.75° F |
| December 28 | 20.91° C | 69.64° F |
| December 27 | 20.8° C | 69.43° F |
| December 26 | 20.82° C | 69.47° F |
| December 25 | 20.99° C | 69.78° F |
| December 24 | 20.94° C | 69.69° F |
| December 23 | 21.11° C | 70° F |
| December 22 | 21.37° C | 70.46° F |
| December 21 | 21.62° C | 70.92° F |
| December 20 | 21.67° C | 71.01° F |
| December 19 | 21.81° C | 71.25° F |
| December 18 | 21.86° C | 71.34° F |
| December 17 | 21.73° C | 71.12° F |
The actual nearshore temperatures may vary by several degrees and this can also be heavily affected by weather. Strong winds can cause cold, deep waters to replace the surface waters that had been warmed by the sun, and heavy rain can also reduce the temperature of the sea surface temperature as well.
Water temperature in Captiva by month
The chart below shows the monthly average water temperature in Captiva.
For more detailed information on how the sea temperature in Captiva changes for each month of the year, choose from the months below.
Captiva map and nearby water temperatures
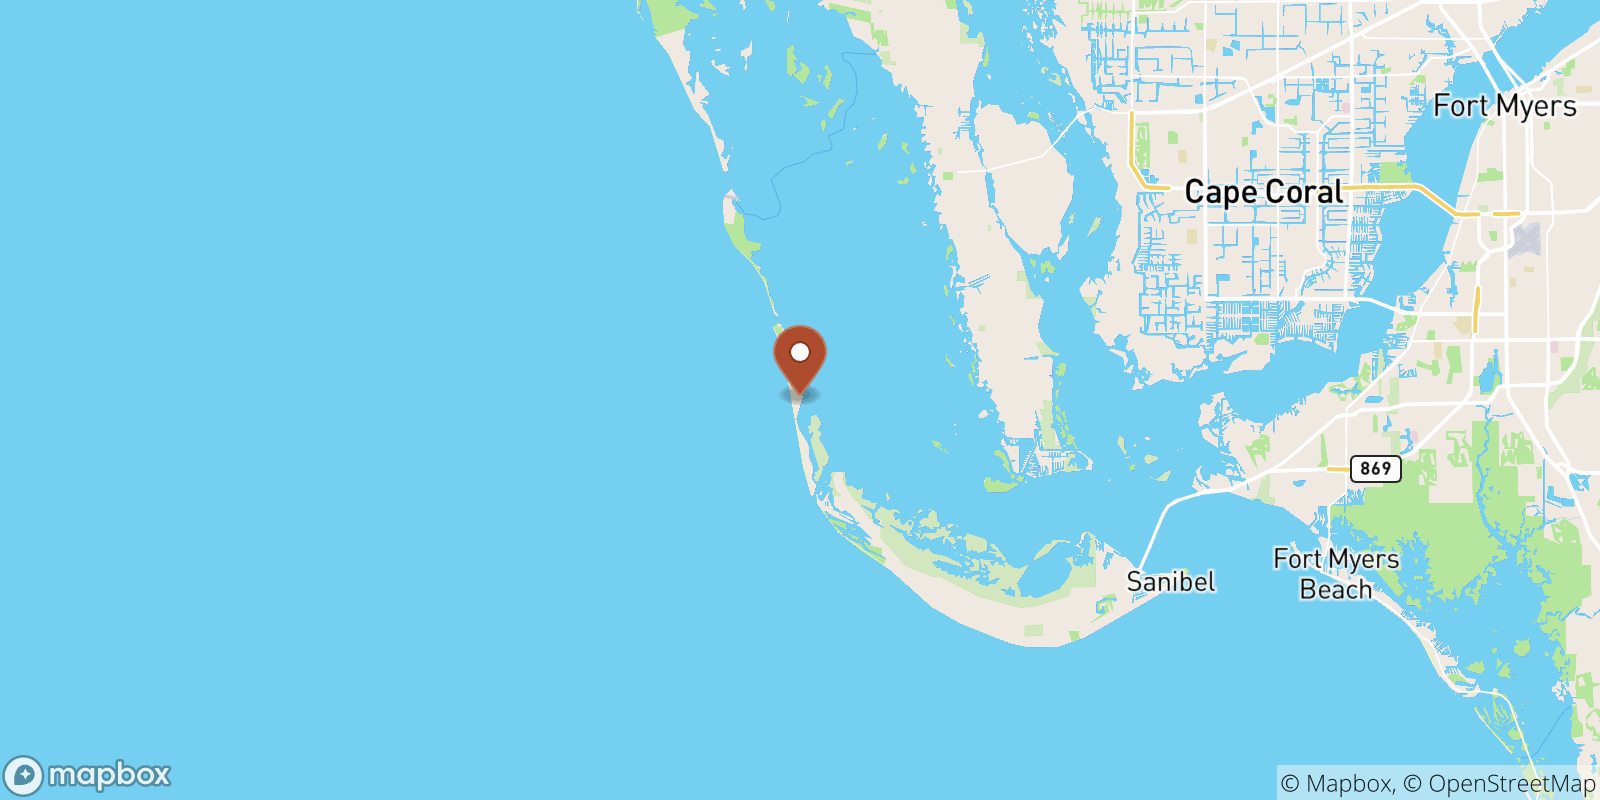
Locations near Captiva


Why measure sea surface temperatures (SST) in Captiva?
The ocean covers about 71% of the Earth's surface, and scientists record the sea surface temperature (SST) of locations such as Captiva because they want to understand and learn how the ocean communicates with the atmosphere of Earth.
SST is one measure that provides information on the global climate, and it can be used to predict the weather in Captiva as well as atmospheric model simulations and to study marine ecosystems in the area.
Data source and citation
Raw data for the calculations made to find the sea surface temperature in Captiva comes from the National Oceanic and Atmospheric Administration (NOAA) and their 1/4° daily Optimum Interpolation Sea Surface Temperature.
The water temperature data is constructed by combining observations from different platforms (satellites, ships, buoys, and Argo floats) on a regular global grid. A spatially complete sea surface temperature map is then built by interpolating to fill in gaps in the data.
If you'd like to use any of the information above in the format it is presented, please use the citation tool below.